Q: Are these curves parallel?

A: I mean, probably not? They look like they might be getting closer together, but if those big steps mean more uncertainty…
Q: Ok, how about with confidence intervals. Now are they parallel?
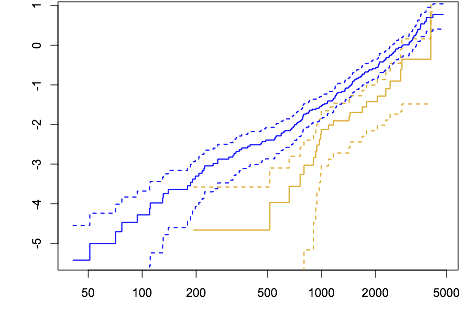
A: Um. I’m not sure that helped. Still a definite maybe
Q: Is this curve horizontal?

A: No. It slopes down. It crosses zero somewhere around 8 or 9 years.
Q: Why do some statistics packages still provide the first graph for assessing departures from proportional hazards, rather than the second?
A: Tradition? Or textbooks?