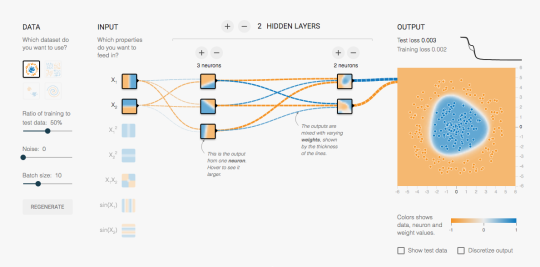
There’s a lovely demonstration of simple neural networks at playground.tensorflow.org, which I recommend to anyone interested in teaching or studying them. It shows the inputs, the hidden nodes, and the output classification, and how they change with training. You can add more neurons or more layers interactively, and fiddle with the training parameters. I wish something like this had been available in the early 90s when I was learning about neural networks.
On the other hand, what it shows is the sort of neural network I learned about in the early 1990s (yes, it has regularisation, but that’s in the mysterious options at the top, not in the fun-to-play-with toys). Back then, neural networks were interesting but not terribly impressive as classifiers. We’d already stopped thinking they really worked like biological neurons, and as black-box semiparametric binary regression models they were only ok.

Modern neural nets suddenly started to give seriously impressive results for image classification just a few years ago, and that’s because size matters. The thousand-fold increase in computation power and training data over the past couple of decades is what neural networks needed. The tensorflow playground shows how the components of a neural network work, but I don’t think they don’t help much with understanding how image classification works in really big networks. After all, Marvin Minsky, one of the inventors of these ‘perceptrons’, famously planned for substantial progress in computer vision as a project for the summer of 1966, as the XKCD cartoon notes.
We’ve had this sort of teaching problem in statistics for years. Textbooks were (are?) full of tiny data sets, small enough that computations can be done on a hand calculator or the data entered by hand into a computer. Students are told to work through all the computational steps; it’s supposed to give them a feeling for the data. What it gives them (apart from a revulsion for data) is a sense of the behaviour of very simple statistics on very small data sets, and increased difficulty in understanding the law of large numbers, the central limit theorem, the curse of dimensionality, and other important facts that don’t show up in a data table.