My attention was drawn on Twitter to an old (1999) paper in The American Statistician, “Different Outcomes of the Wilcoxon-Mann-Whitney Test from Different Statistics Packages.” The authors looked at 11 statistics packages and found they didn’t always give the same result for the Wilcoxon/Mann-Whitney test. The big problem was handling of tied observations.
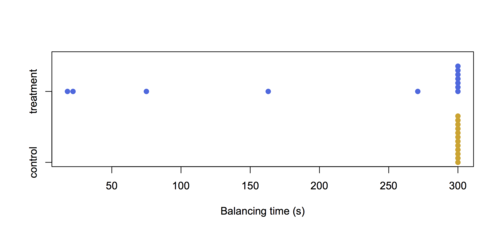
Here are their example data:

The authors say “It is obvious that the data resulting from the experiment could not be analyzed by the Student’s t-test.” I would argue that with 19 of 24 data points identical, a test based on ranks isn’t very attractive, either.
The experiment involved making rats balance on a rotating cylinder, and the treatment was a muscle relaxant. The values at 300s are really censored– the rat hadn’t fallen off after five minutes – so the problem of ties is artificial.
At least this example doesn’t have the transitivity problem: it makes sense that the treatment would only make the time shorter, not longer, so the distributions in the two groups should be stochastically ordered if they are different. But the large number of ties makes it harder to get an exact \(p\)-value for the Wilcoxon/Mann-Whitney test (which is the main point of the test) and also makes the mean rank a less interesting statistic.
It would make more sense either to treat the data as binary (300 or not) or, even better, as censored, which gets rid of the ties problem. With the Wilcoxon test on the measurements as given, the p-value is about 0.085 pretending it’s a continuous distribution, or about 0.015 using a correction for ties.
Treating the censoring appropriately and using the \(G^\rho\) weighted logrank test with \(\rho=1\) (which reduces to the Wilcoxon test in uncensored data) gives a \(p\)-value of 0.014. No problem with ties; no problem with software.
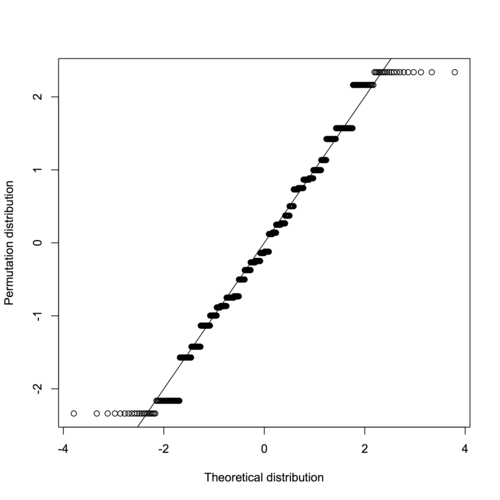
And, while it might be “obvious” to the authors that a \(t\)-test cannot be used, the only reason I’d agree is that the data are censored. The permutation distribution of the Student \(t\)-statistic agrees very well with its nominal \(t_{22}\) distribution. With groups of equal sizes, the \(t\)-test has excellent robustness of level. Its power is not robust to outliers, but in this example that’s a feature, not a bug: you want a test that is able to notice how much smaller the values are in the treatment group.

The paper is basically arguing for the permutation distribution in tests like this one, and says that Wilcoxon proposed his test to make permutation inference computationally simpler than it would be for, say, the difference in means. That was true in 1945. It wasn’t true in 1999, and it certainly isn’t true now: the advantage of a permutation approach is that you get to use whatever summary of the difference between groups you want; you don’t need to choose it for mathematical convenience.